
As we approach the final chapter in our exploration into the GA4 BigQuery export, it’s time to put your newfound skills to the test. Over the past 8 tutorials, we’ve equipped you with the knowledge to navigate your way around the GA4 data in BigQuery. Now, we’re ready to harness that expertise to recreate familiar Google Analytics metrics and weave them into comprehensive BigQuery reports. This last leg of our journey is where it all comes together.
This is part 9 of 10 in our series, “Get Started with the GA4 BigQuery Export”. Check out the course overview for a full list of all the topics covered.
Introduction
As you will have seen by now, each line in the BigQuery export represents a separate event, whether it’s a user visiting a webpage, clicking a button, or performing any other action on your website or app.
While this granular level of detail is incredibly valuable, it also means that if we want to derive essential high-level metrics like Users or Sessions, we need to aggregate these events using one of the built-in functions in SQL. These functions become our allies in transforming raw data into useful and meaningful metrics.
Recreating GA4 metrics
In this section, we’ll guide you through the process of creating fundamental metrics that are often the building blocks of more complex analyses. You’ll learn how to craft code to recreate 3 of the most commonly used metrics from GA4 – Total Users, Sessions and Views.
Important Note: In all the queries provided below, make sure to replace the placeholders within the WHERE clause with the specific values for the table you are working with. For example, if you want to extract data for January 31st 2021 from the e-commerce sample dataset, use the following values:
- <project> should be replaced with bigquery-public-data
- <dataset> should be replaced with ga4_obfuscated_sample_ecommerce
- <table> should be replaced with events_20210131
Ensure that you substitute these placeholders with your actual project, dataset, and table names when executing the queries.
Calculate total users
Each user tracked by GA4 is assigned a unique pseudonymous ID, which is stored in the user_pseudo_id field. So to calculate Total Users, we need to do a count of distinct user_pseudo_id:
SELECT
  COUNT(DISTINCT user_pseudo_id) AS total_users
FROM `<project>.<dataset>.<table>`
Calculate sessions
To calculate Sessions we combine the user_pseudo_id with the ga_session_id. This concatenation allows us to identify and count distinct session interactions effectively:
SELECT
  COUNT(DISTINCT CONCAT(user_pseudo_id, (SELECT value.int_value FROM UNNEST(event_params) WHERE key = 'ga_session_id'))) AS sessions
FROM `<project>.<dataset>.<table>`
Calculate views
The Views metric represents both page views and screen views. So to calculate this metric we need to do a count of total events where event_name = page_view or screen_view:
SELECT
  COUNTIF(event_name IN ('page_view', 'screen_view')) AS views
FROM `<project>.<dataset>.<table>`
Creating reports in BigQuery
Now that we’ve learned how to recreate the basic metrics, let’s combine them with some dimensions to build a report. We’re going to create 2 simple reports – a daily performance report and a top pages report.
We’ll show you how to download the results or explore them as a spreadsheet or visualisation. We will also guide you through the process of creating dedicated tables from your report data. These tables can become the backbone of interactive data visualization in platforms like Data Studio or Power BI, so it’s an invaluable skill to learn.
Create daily performance report
The below query will generate a daily count of key metrics for the last 7 days. Refer to the comments inline for an explanation of the code.
SELECT
-- format the date as YYYY-MM-DD
PARSE_DATE('%Y%m%d', event_date) AS event_date,
-- count the no. of unique users
COUNT(DISTINCT user_pseudo_id) AS total_users,
-- concatenate user_pseudo_id and ga_session_id and then count the no. of unique instances
COUNT(DISTINCT CONCAT(user_pseudo_id, (SELECT value.int_value FROM UNNEST(event_params) WHERE key = 'ga_session_id'))) AS sessions,
-- count the no. of page_view and screen_view events
COUNTIF(event_name IN ('page_view', 'screen_view')) AS views,
-- divide sessions by total users and round the result to 2 decimal places
ROUND(COUNT(DISTINCT CONCAT(user_pseudo_id, (SELECT value.int_value FROM UNNEST(event_params) WHERE key = 'ga_session_id'))) / COUNT(DISTINCT user_pseudo_id), 2) AS sessions_per_user,
-- divide views by total users and round the result to 1 decimal place
ROUND(COUNTIF(event_name IN ('page_view', 'screen_view')) / COUNT(DISTINCT user_pseudo_id), 1) AS views_per_user
-- apply the * wildcard to table name
FROM `<project>.<dataset>.events_*`
-- only include records found in the tables from the last 7 days
WHERE _TABLE_SUFFIX BETWEEN
FORMAT_DATE('%Y%m%d',DATE_SUB(CURRENT_DATE(), INTERVAL 7 day))
AND FORMAT_DATE('%Y%m%d',DATE_SUB(CURRENT_DATE(), INTERVAL 1 day))
-- aggregate results by the 1st column (event_date)
GROUP BY 1
-- order by the 1st column (event_date) in descending order
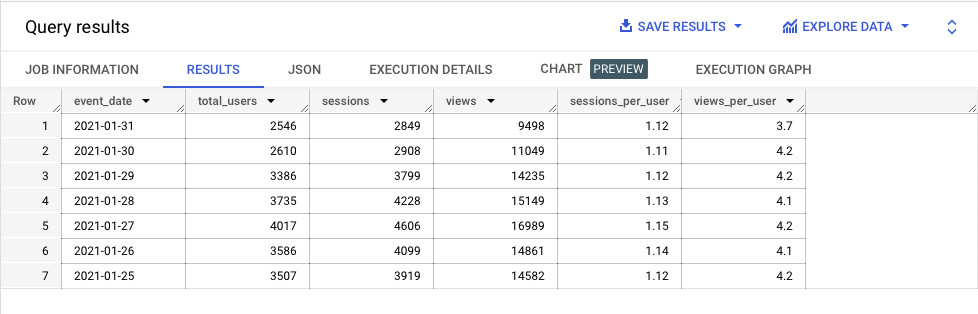
ORDER BY 1 DESCYou should end up with a report that looks something like below.
Create top pages report
The below query will generate a view of the top 10 most viewed pages in August 2023. Refer to the comments inline for an explanation of the code.
SELECT
-- extract the page URL from event_params
(SELECT value.string_value FROM UNNEST(event_params) WHERE key = 'page_location') AS page,
-- count the no. of events
COUNT(*) AS views,
-- count the no. of unique users
COUNT(DISTINCT user_pseudo_id) AS total_users,
-- divide views by total users and round the result to 1 decimal place
ROUND(COUNT(*) / COUNT(DISTINCT user_pseudo_id), 1) AS views_per_user
-- query all tables from Jan 2021
FROM `<project>.<dataset>.events_202308*`
-- filter to page_view events only
WHERE event_name = 'page_view'
-- aggregate results by the 1st column (page)
GROUP BY 1
-- order by the 2nd column (views) in descending order
ORDER BY 2 DESC
-- limit results to the top 10
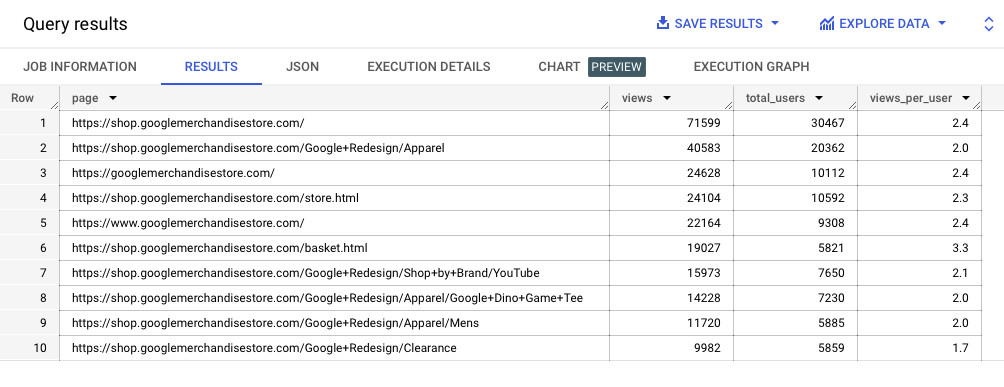
LIMIT 10You should end up with a report that looks like the example below.
Analyze and explore the results
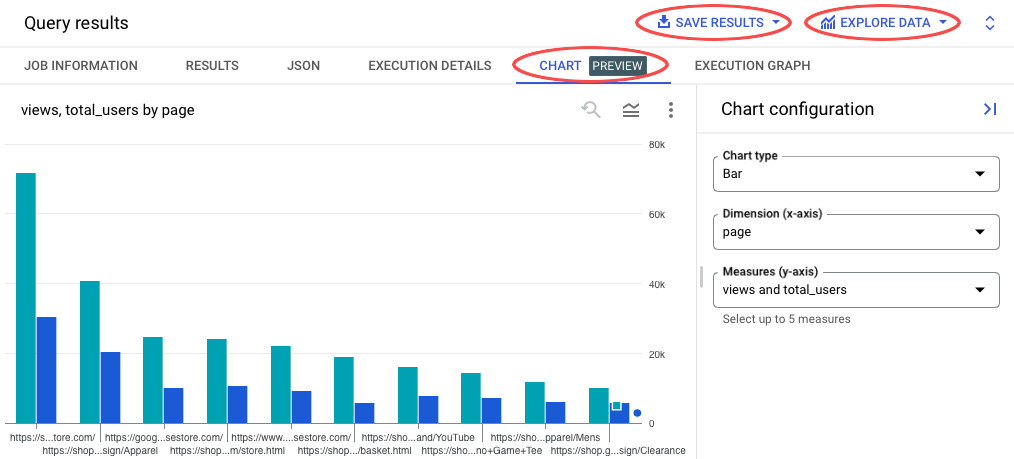
After you run a query in BiqQuery you then have a few different options to further analyze and explore the data.
- Save Results – select this option to download the results in a CSV or JSON file, export to Google Sheets or even save to a new BigQuery table
- Explore Data – connect the results to a Google Sheet, Looker Studio dashboard or Python notebook
- Chart – visualize the results with a basic chart right in the BigQuery UI
Create new BigQuery tables
The final point we’ll touch on is how to create your own reporting tables within BigQuery, which you can then connect to external tools like Power BI, Datastudio or Tableau.
You could, of course connect these tools directly to the GA4 export tables but I would strongly advise against doing so. Not only would your reports likely be very slow (due to having to query large volumes of data), you would also run the risk of racking up large costs because each request to view a report, change a filter, etc. would mean a new query being made against the table.
A far better approach is to write a query in BigQuery to aggregate the data at the level you require and then save that to a new table which you can connect your visualization tool to. This aggregated table should be much smaller and far less likely to encounter query costs.
Creating a table is in fact very easy, you just need to wrap your query inside a CREATE OR REPLACE function, like below (note: the project and dataset you specify must already exist for this query to run successfully).
CREATE OR REPLACE TABLE `<project>.<dataset>.<table>` AS (

// enter query here

)
Wrapping up
With the completion of this tutorial, you’ve added the final pieces to your GA4 BigQuery export toolkit. You’ve learned to recreate essential metrics, craft insightful reports, and even create dedicated tables for visualization.
Now, equipped with the ability to aggregate data, calculate metrics, and build reports, you’re prepared to unlock the full potential of your GA4 data within BigQuery.
As we conclude this tutorial, stay tuned for the final installment, where we’ll provide a comprehensive summary of all the topics covered throughout the series and point you towards more resources that will help you further expand your knowledge.