
Funnel reports can be incredibly useful in helping you to identify issues on your site, and to understand which parts of the user journey need optimisation. In this tutorial we show you how to create a customised funnel report in BigQuery to track any set of actions on your website or app.
Introduction
A funnel report provides a breakdown of the steps in a journey that your users might take, such as making a purchase or signing up. By visualising the user journey step by step, you can pinpoint the places where users are dropping off or experiencing issues.
Some of the benefits of creating a funnel report for your website or app include:
- Identifying Conversion Roadblocks: Funnel reports reveal the roadblocks in your conversion process, helping you understand where users are abandoning their journey.
- Optimizing User Experience: Armed with funnel insights, you can make informed decisions to enhance the user experience at crucial stages, thereby boosting overall conversion rates.
- Measuring Campaign Effectiveness: You can evaluate the success of your marketing campaigns by tracking user progression through various touch points.
Types of funnel report
If you were running an e-commerce store then an example funnel could be the journey from the homepage through to completing a purchase. Let’s imagine a simple 4-step funnel:
- Homepage view
- Product page view
- Add product to cart
- Purchase
Basic funnel report
You could create a very basic funnel report by just counting the number of users who performed each action, however you would have no guarantee that each user had completed all the actions in the journey.
In the example above, a user could enter the site at the product page rather than the homepage, or they could view numerous products but only add 1 to the cart, or they could have a product in their cart from a previous visit and thus complete a purchase without any of the previous 3 steps.
So with all these possible scenarios, a basic funnel report of the type described above would not give an accurate view of the journey.
Sequential and closed funnels
A sequential funnel ensures that users have completed the steps of the journey in the correct order (this obviously therefore requires that all the steps in the journey are compulsory). A closed funnel is one in which a user is only counted if they enter the journey at step 1 – in our earlier example, that means we wouldn’t count those users who entered the site on the product page.
GA4 funnel exploration report
You may already be familiar with the funnel exploration report in GA4. This is one of the report types available within the Explore module which enables you to create a funnel visualisation based on the actions that form part of your user journey.
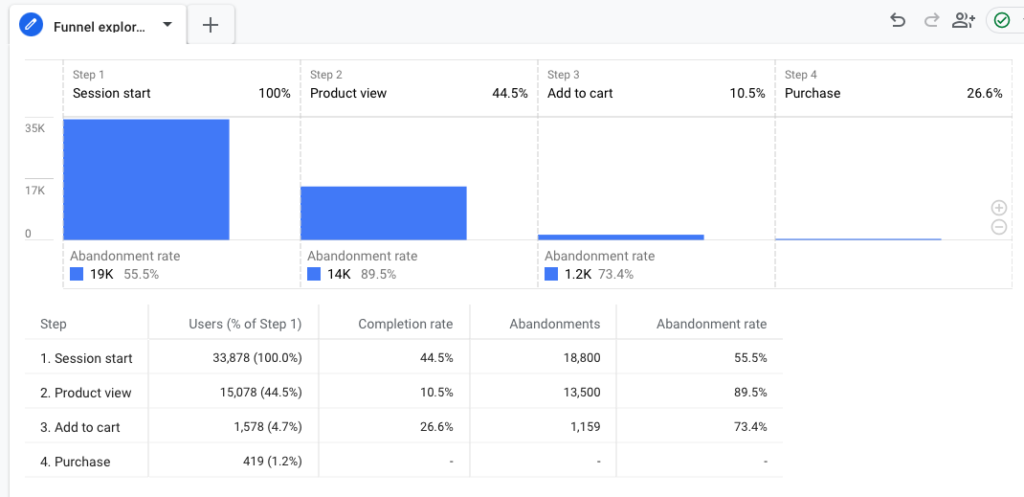


We will be creating a funnel report that looks similar to this. We’ll use BigQuery to extract the data from the GA4 events tables, and then Looker Studio to visualise the funnel.
Creating your funnel report
For this tutorial we are going to be using the GA4 e-commerce sample dataset. If unsure, this tutorial explains how to connect to the GA4 sample datasets.
We are going to create a relatively simple 4-step funnel, but you can include as many, or as few, steps as is relevant to your specific business. We’ll start out by first identifying the actions which define each stage of the funnel, then write a CTE to extract the users who performed those actions. We’ll then join together the steps for each user and calculate the number of users and progression rates for each stage. Finally, we’ll create a visualisation in Looker Studio.
We’re going to create a user-funnel, rather than a session-funnel, which means we’ll include users regardless of whether they completed the steps within a single session or across multiple sessions. To do so we’ll be counting the user_pseudo_id field, but you could easily modify the queries to count sessions instead.
Define the funnel steps
Before writing any code, you first need to define the steps that form the user journey you want to track. In this example we are going to track the purchase funnel which includes the following steps:
- Viewed an item – event_name = ‘view_item’
- Added item to the cart – event_name = ‘add_to_cart’
- Started to checkout – event_name = ‘begin_checkout’
- Completed purchase – event_name = ‘purchase’
We’ll also include the date as a dimension in the report, which means we can see how the performance of the funnel changes over time.
Flattening the data
The very first part of our query is a CTE that extracts all the necessary data from the events_ table for use later on. We extract the user_pseudo_id, event_name, event_date and event_timestamp, also performing transformations on the later 2 fields.
WITH dataset AS (
    SELECT
        user_pseudo_id,
        event_name,
        PARSE_DATE('%Y%m%d', event_date) AS event_date,
        TIMESTAMP_MICROS(event_timestamp) AS event_timestamp
    FROM `bigquery-public-data.ga4_obfuscated_sample_ecommerce.events_202101*`
    WHERE event_name IN ('view_item', 'add_to_cart', 'begin_checkout', 'purchase')
),
Step 1 – view item
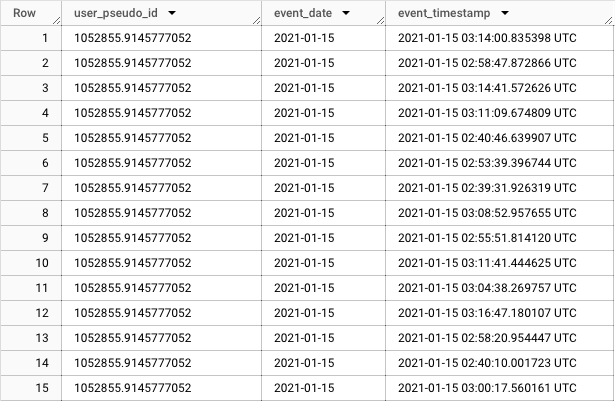
The next CTE extracts a list of users who have triggered the view_item event. We also include the event_date and the event_timestamp to ensure we are joining events on the correct day and in the correct order.
view_item AS (
    SELECT
        user_pseudo_id,
        event_date,
        event_timestamp
    FROM dataset
    WHERE event_name = 'view_item'
),
If you were to run a SELECT statement on this CTE the results would look something like below.
Step 2 – add to cart
The third CTE extracts a list of users who have triggered an add_to_cart event. Again, we include the event_date and event_timestamp so that the pages can be correctly joined together between step 1 and 2.
If you were to run a SELECT statement on this CTE the results would look similar to those above.
add_to_cart AS (
    SELECT
        user_pseudo_id,
        event_date,
        event_timestamp
    FROM dataset
    WHERE event_name = 'add_to_cart'
),
Step 3 – begin checkout
The next CTE extracts a list of users who have triggered a begin_checkout event. By now you’re probably starting to see a pattern – we’re extracting the same fields each time, just modifying the event_name in the WHERE clause.
begin_checkout AS (
    SELECT
        user_pseudo_id,
        event_date,
        event_timestamp
    FROM dataset
    WHERE event_name = 'begin_checkout'
),
Step 4 – purchase
Lastly, we extract a list of users who have triggered the purchase event. Again, we include the same fields as previously so that we can join all the steps together.
purchase AS (
    SELECT
        user_pseudo_id,
        event_date,
        event_timestamp
    FROM dataset
    WHERE event_name = 'purchase'
),
Calculating the funnel
In the final CTE we join the 4 steps together and then count the number of users who have made it to each stage. You’ll notice that we are including multiple conditions in each JOIN.
By joining on user_pseudo_id we ensure that only users who have viewed an item will be included in step 2, only those who have added to cart will be included in step 3, and only those who began checkout will be included in step 4.
We use the event_timestamp in the join to ensure that we’re only counting instances where the earlier steps happened before the later.
And by joining on the event_date we ensure that we’re only counting users who completed the action on the same day.
funnel AS (
    SELECT
        vi.event_date,
        COUNT(DISTINCT vi.user_pseudo_id) AS view_item,
        COUNT(DISTINCT atc.user_pseudo_id) AS add_to_cart,
        COUNT(DISTINCT bc.user_pseudo_id) AS begin_checkout,
        COUNT(DISTINCT p.user_pseudo_id) AS purchase
    FROM view_item vi
    LEFT JOIN add_to_cart atc
        ON vi.user_pseudo_id = atc.user_pseudo_id
        AND vi.event_date = atc.event_date
        AND vi.event_timestamp < atc.event_timestamp
    LEFT JOIN begin_checkout bc
        ON atc.user_pseudo_id = bc.user_pseudo_id
        AND atc.event_date = bc.event_date
        AND atc.event_timestamp < bc.event_timestamp
    LEFT JOIN purchase p
        ON bc.user_pseudo_id = p.user_pseudo_id
        AND bc.event_date = p.event_date
        AND bc.event_timestamp < p.event_timestamp
    GROUP BY 1
)
Calculating progression rates
In the last section of the query we calculate the add_to_cart_rate, begin_checkout_rate and purchase_rate – which is the percentage of users from the 1st step who made it to each of those stages.
We also set the view_item_rate to 1 because it’s the start of the funnel so 100% of users reached performed that action.
SELECT
    event_date,
    view_item,
    add_to_cart,
    begin_checkout,
    purchase,
    1 AS view_item_rate,
    ROUND(COALESCE(add_to_cart / NULLIF(view_item,0), 0), 2) AS  add_to_cart_rate,
    ROUND(COALESCE(begin_checkout / NULLIF(view_item,0), 0), 2) AS  begin_checkout_rate,
    ROUND(COALESCE(purchase / NULLIF(view_item,0), 0), 2) AS  purchase_rate
FROM funnel
ORDER BY 1 ASC
Generating the report
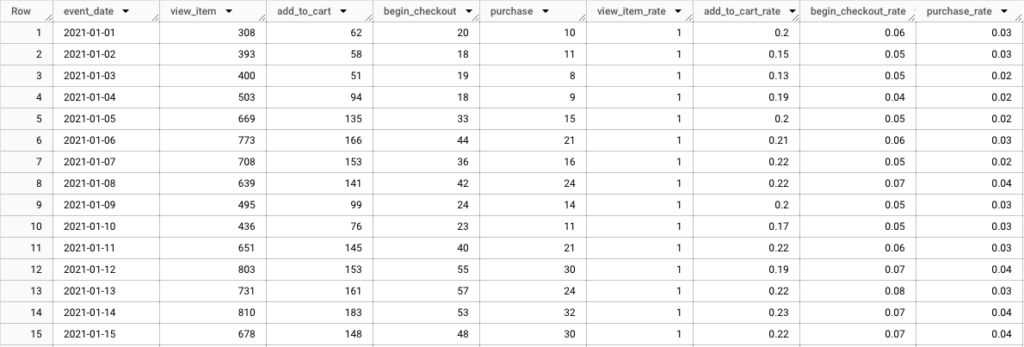
You should now have a complete query, which if you execute will generate a report that looks something like below.
For reference, I’ve included the query in it’s entirety below:
WITH dataset AS (
    SELECT
        user_pseudo_id,
        event_name,
        PARSE_DATE('%Y%m%d', event_date) AS event_date,
        TIMESTAMP_MICROS(event_timestamp) AS event_timestamp
    FROM `bigquery-public-data.ga4_obfuscated_sample_ecommerce.events_202101*`
    WHERE event_name IN ('view_item', 'add_to_cart', 'begin_checkout', 'purchase')
),

view_item AS (
    SELECT
        user_pseudo_id,
        event_date,
        event_timestamp
    FROM dataset
    WHERE event_name = 'view_item'
),

add_to_cart AS (
    SELECT
        user_pseudo_id,
        event_date,
        event_timestamp
    FROM dataset
    WHERE event_name = 'add_to_cart'
),

begin_checkout AS (
    SELECT
        user_pseudo_id,
        event_date,
        event_timestamp
    FROM dataset
    WHERE event_name = 'begin_checkout'
),

purchase AS (
    SELECT
        user_pseudo_id,
        event_date,
        event_timestamp
    FROM dataset
    WHERE event_name = 'purchase'
),

funnel AS (
    SELECT
        vi.event_date,
        COUNT(DISTINCT vi.user_pseudo_id) AS view_item,
        COUNT(DISTINCT atc.user_pseudo_id) AS add_to_cart,
        COUNT(DISTINCT bc.user_pseudo_id) AS begin_checkout,
        COUNT(DISTINCT p.user_pseudo_id) AS purchase
    FROM view_item vi
    LEFT JOIN add_to_cart atc
        ON vi.user_pseudo_id = atc.user_pseudo_id
        AND vi.event_date = atc.event_date
        AND vi.event_timestamp < atc.event_timestamp
    LEFT JOIN begin_checkout bc
        ON atc.user_pseudo_id = bc.user_pseudo_id
        AND atc.event_date = bc.event_date
        AND atc.event_timestamp < bc.event_timestamp
    LEFT JOIN purchase p
        ON bc.user_pseudo_id = p.user_pseudo_id
        AND bc.event_date = p.event_date
        AND bc.event_timestamp < p.event_timestamp
    GROUP BY 1
)

SELECT
    event_date,
    view_item,
    add_to_cart,
    begin_checkout,
    purchase,
    1 AS view_item_rate,
    ROUND(COALESCE(add_to_cart / NULLIF(view_item,0), 0), 2) AS  add_to_cart_rate,
    ROUND(COALESCE(begin_checkout / NULLIF(view_item,0), 0), 2) AS  begin_checkout_rate,
    ROUND(COALESCE(purchase / NULLIF(view_item,0), 0), 2) AS  purchase_rate
FROM funnel
ORDER BY 1 ASC
Saving the data
Before heading over to Looker Studio to build out the visualisation, we’ll first save the results to a new BigQuery table. To do so, click on SAVE RESULTS then BigQuery table.
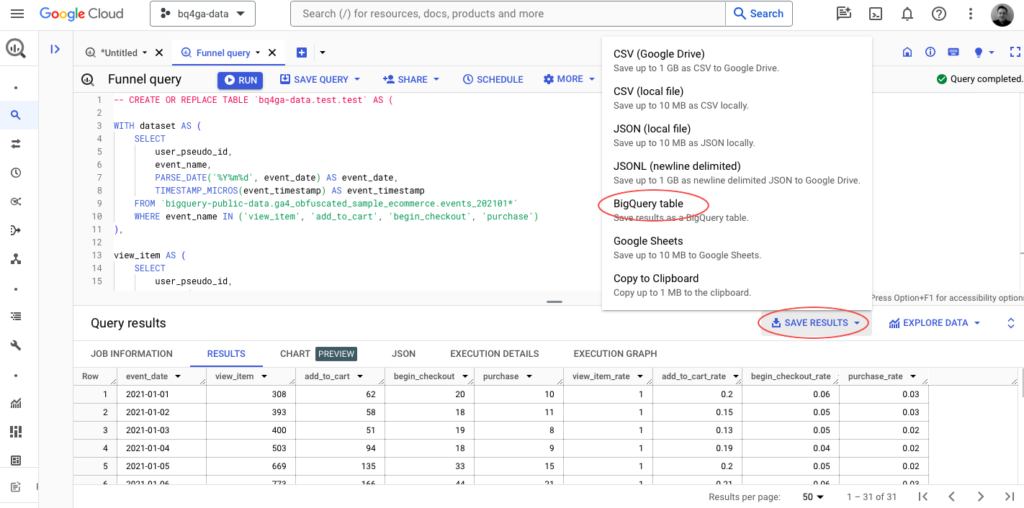
Follow the prompts on screen to create your table (you might also need to create a new dataset first) and then go to Looker Studio and create a new blank report.
Creating the visualisation
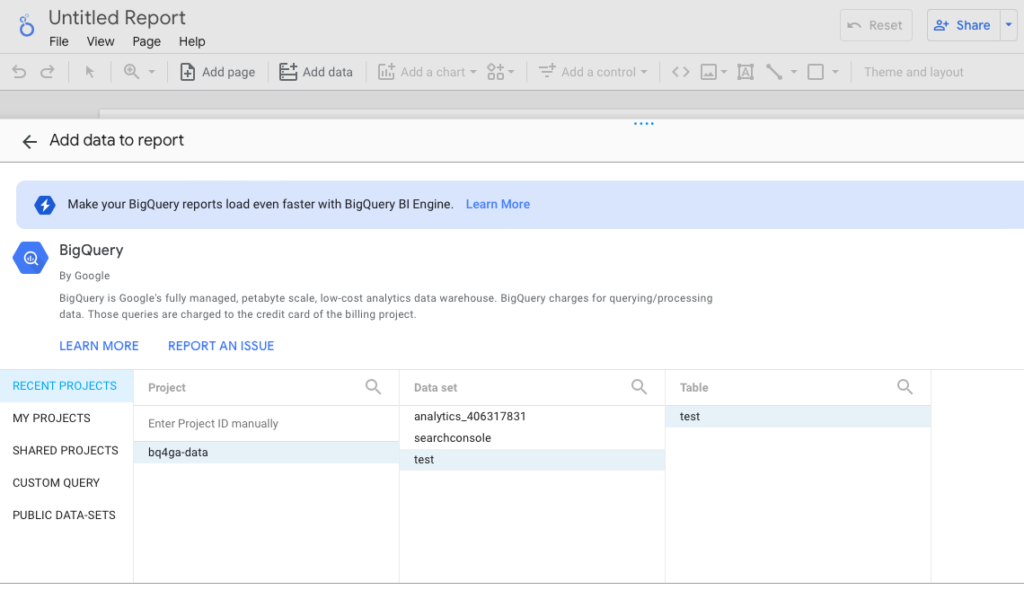
When creating a report in Looker Studio, you will first be asked to connect to a data source – you should see BigQuery listed as an option. On the next screen, select your project and then the data set and table you just created, then click Add.
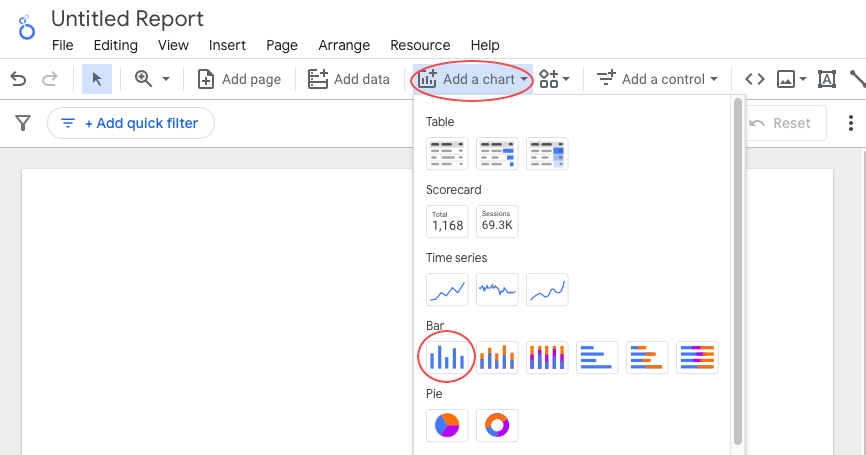
After the reports workspace loads, click Add a chart and then select the Bar/Column option and place it on the page:
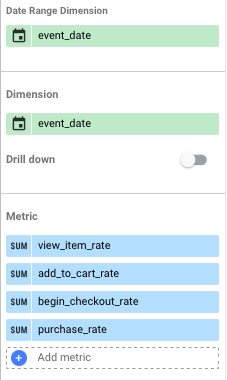
You then want to add the following dimensions and metrics:
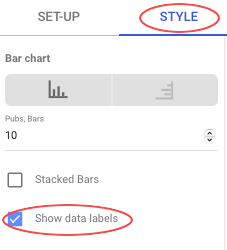
Next click on STYLE and check Show data labels:
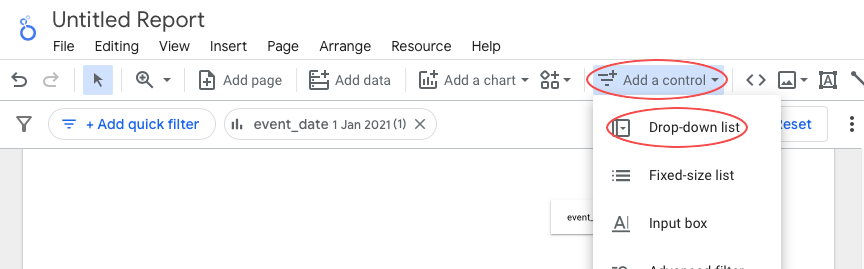
Then click Add a control and select Drop-down list and you’ll be able to add a date selector so you can the view data for each day individually.
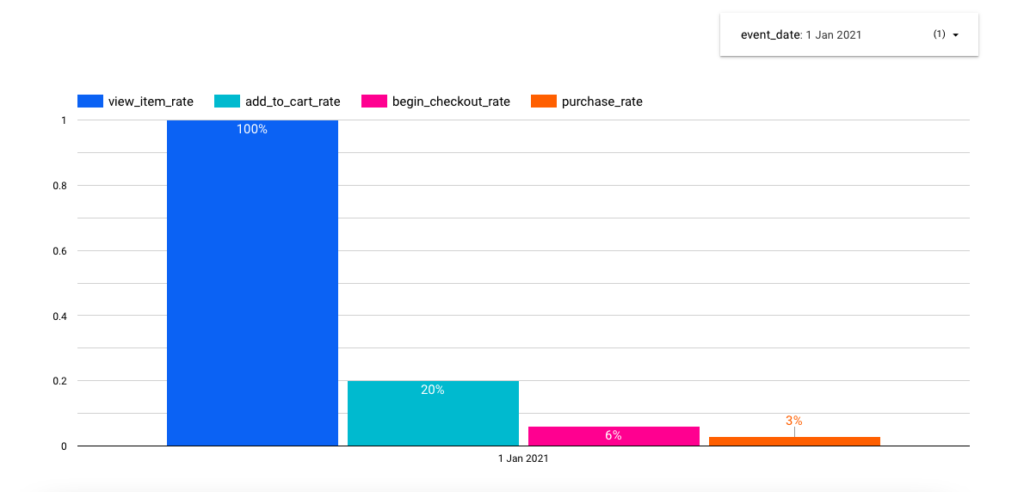
Now when you select an individual day you should hopefully end up with a report that looks something like the below. You can obviously do loads more to customise this, but as a basic report this provides a good view of the progression and drop-off between steps.
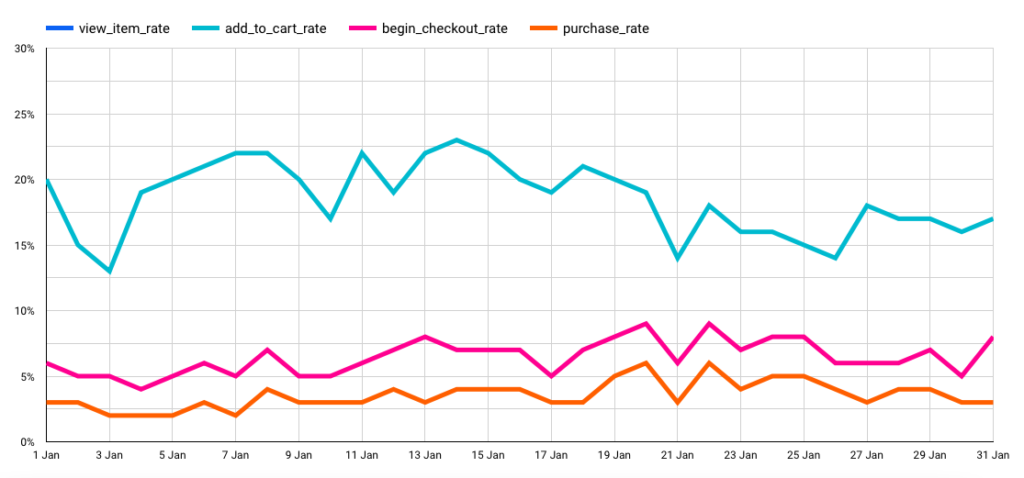
Another option you have when the data is broken down by day is to create a trended funnel report, which will help you to see how the progression rates change over time. This can be accomplished with a time-series chart and the same metrics as previously.
Wrapping up
Funnel reports can be a great tool to help you measure the performance of your website or app. BigQuery gives you the power to go beyond the standard reporting available in the GA4 UI and fully customise them to meet the needs of your business.
There are so many possibilities of what you could build so I hope you’ve found this tutorial useful and you are able to adapt these techniques to meet your own specific use cases.